When Color Constancy Goes Wrong:
Correcting Improperly White-Balanced Images
Mahmoud Afifi1, Brian Price2, Scott Cohen2, and Michael S. Brown1
1York University, 2Adobe Research
Our method is compared with common approaches that are currently used to correct an improperly white balanced sRGB image. We compared our results against the diagonal correction applied directly to the sRGB image (denoted as sRGB) and after applying the "linearization" process (denoted as LRGB) using the exact achromatic reference point and Adobe Photoshop functions: auto-color (AC), and auto-tone (AT). Note that the exact reference point represents the best possible white reference (i.e., extracted from a color chart) and would not be available in most real scenarios. Additionally, we compared our results with different other methods for illumination estimation - we have excluded some of the recent learning-based illuminant estimation methods since they were mostly trained on the linear RGB space. The methods are: gray world (GW) [1], gray edges (GE) [2], weighted gray edges (wGE) [3], max-RGB [4], shades of gray (SoG) [5], FC4 [6], and Quasi-unsupervised color constancy (Quasi-U CC) [7]. For the learning methods (namely, FC4 and Quasi-U CC), we have used the trained models provided by the authors. For the statistical methods (namely, GW, GE, wGE, max-RGB, and SoG), we have used the source code from colorconstancy.com with the following parameters:
- Weighted gray edges: mink_norm = 5, sigma = 2, kappa = 10;
- Gray edges: mink_norm=5, sigma=2, first and second differentiations
- Shades of gray: mink_norm=5
We reported the mean, lower quartile (Q1), median (Q2), and the upper quartile (Q3) of the error between the corrected images and the corresponding ground truth images. We used four different evaluation metrics, which are: (1) mean squared error (MSE), (2) mean angular error (MAE), (3) delta E 2000, and (4) delta E 76.
You can download our source code to calculate the error with these evaluation metrics from here.
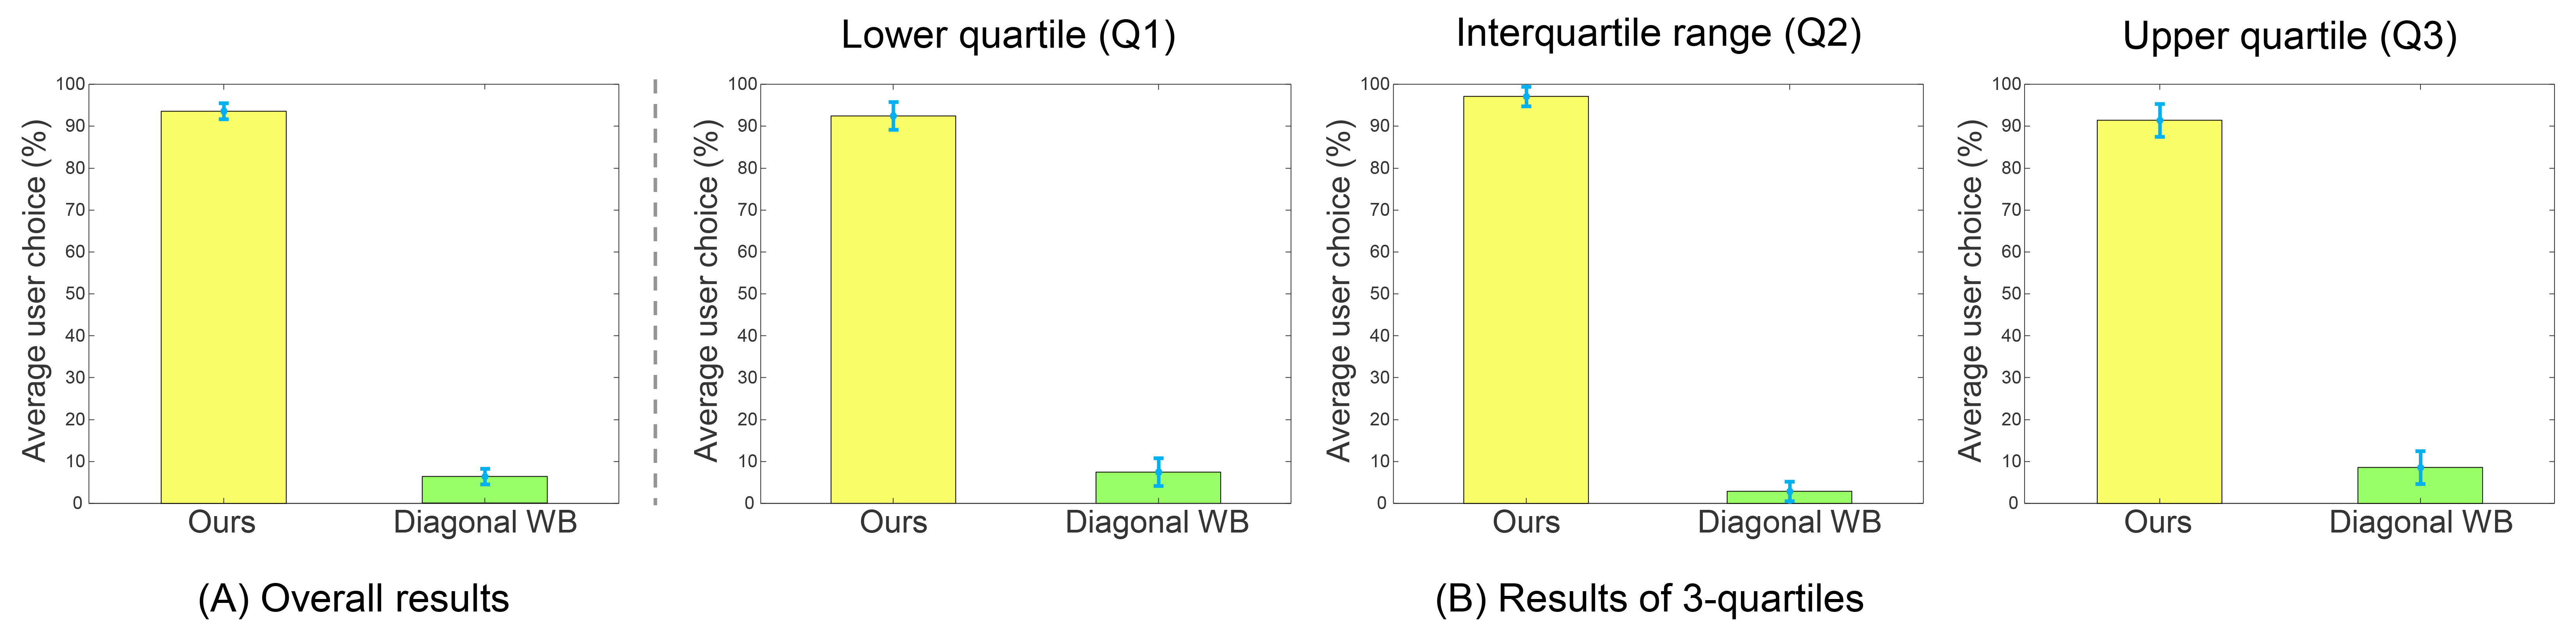
Qualitative results (user study)
We have conducted a user study of 35 participants (18 males and 17 females), ranging in age from 21 to 46. Each one was asked to choose the most visually similar image to the ground truth image between our and the corresponding results of diagonal correction using the exact achromatic reference point. Experiments were carried out in a controlled environment. The monitor was calibrated using a Spyder5 Colorimeter. Participants were asked to compare 24 pairs of images, such that for each quartile, based on the MSE of each method, 4 images were randomly picked from Set 1 and Set 2. That means the selected images represent the best, median, and worst results of each method and for each set. On average, 93.69% of our results were chosen as the most similar to the ground truth images.
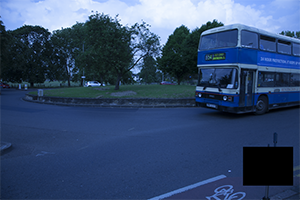
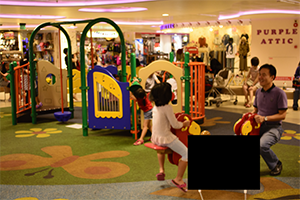
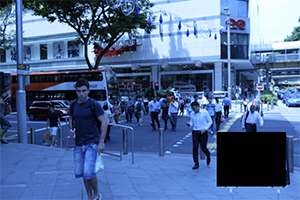
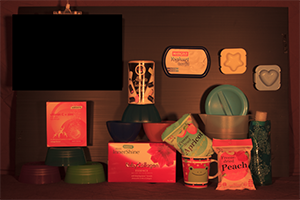
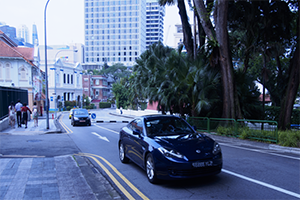
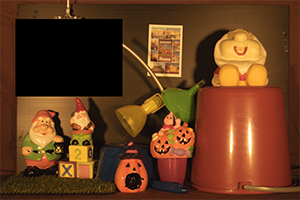
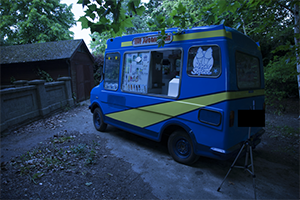
Examples of our results:
Quantitative results (Set 1)
We have used Set 1 for training and evaluation using three-fold validation, such that the three folds are disjointed in regards to the imaged scenes, meaning if the scene (i.e., original raw image) appears in a fold, it is excluded from the other folds. You can download the 3 folds from here for further comparisons. The color chart is masked out in the image and ignored during training and testing. Note that, the report results do not represent the mean of the three-folds; instead, we reported the statistics of the entire results. For example, the mean of the MSE represents the mean of the MSE values of all images in Set 1. To compute the mean error for each image, please remember to subtract the calibration object's pixels from the total number of image pixels. Please, check our source code to compute the error between corrected and ground-truth images from here. *You can download this table as a LaTeX file from here*.
| Method | MSE | MAE | Delta E 2000 | |||||||||
|---|---|---|---|---|---|---|---|---|---|---|---|---|
| Mean | Q1 | Q2 (median) | Q3 | Mean | Q1 | Q2 (median) | Q3 | Mean | Q1 | Q2 (median) | Q3 | |
| Adobe Photoshop (AC) | 780.52 | 157.39 | 430.96 | 991.28 | 7.96 | 3.43 | 5.59 | 10.58 | 10.06 | 5.75 | 8.92 | 13.30 |
| Adobe Photoshop (AT) | 1002.93 | 238.33 | 606.74 | 1245.51 | 7.56 | 3.08 | 5.75 | 10.83 | 11.12 | 6.55 | 10.54 | 14.68 |
| Gray world [1] (sRGB) | 282.76 | 70.50 | 180.81 | 380.89 | 7.23 | 4.14 | 6.40 | 9.51 | 7.99 | 5.08 | 7.47 | 10.40 |
| Gray world [1] (LRGB) | 285.51 | 73.37 | 184.72 | 384.67 | 7.97 | 4.36 | 6.91 | 10.53 | 8.48 | 5.38 | 7.91 | 11.03 |
| Gray edges-1 [2] (sRGB) | 193.99 | 43.38 | 119.93 | 267.84 | 6.81 | 3.22 | 5.49 | 9.31 | 6.86 | 3.92 | 6.30 | 9.17 |
| Gray edges-1 [2] (LRGB) | 190.59 | 42.51 | 116.75 | 261.6 | 6.54 | 3.22 | 5.37 | 8.78 | 6.82 | 3.91 | 6.20 | 9.06 |
| Gray edges-2 [2] (sRGB) | 208.20 | 44.82 | 126.83 | 285.31 | 7.03 | 3.30 | 5.67 | 9.62 | 7.06 | 4.01 | 6.44 | 9.44 |
| Gray edges-2 [2] (LRGB) | 204.93 | 43.86 | 123.19 | 279.15 | 6.76 | 3.31 | 5.54 | 9.12 | 7.02 | 4.01 | 6.35 | 9.32 |
| Weighted gray edges [3] (sRGB) | 225.87 | 42.76 | 122.39 | 300.48 | 7.15 | 3.20 | 5.60 | 9.69 | 7.07 | 3.78 | 6.29 | 9.50 |
| Weighted gray edges [3] (LRGB) | 223.30 | 42.40 | 119.47 | 294.22 | 6.90 | 3.17 | 5.42 | 9.26 | 7.05 | 3.76 | 6.21 | 9.43 |
| Max-RGB [4] (sRGB) | 285.07 | 47.20 | 160.6 | 397.79 | 8.48 | 3.49 | 7.03 | 12.35 | 8.05 | 3.97 | 7.25 | 11.34 |
| Max-RGB [4] (LRGB) | 280.86 | 46.21 | 156.09 | 390.99 | 8.17 | 3.41 | 6.76 | 11.83 | 7.96 | 3.92 | 7.12 | 11.21 |
| Shades of gray [5] (sRGB) | 171.30 | 38.31 | 104.85 | 235.57 | 6.06 | 2.99 | 5.08 | 8.21 | 6.19 | 3.52 | 5.72 | 8.25 |
| Shades of gray [5] (LRGB) | 169.33 | 38.10 | 102.21 | 231.50 | 5.96 | 3.03 | 5.03 | 7.91 | 6.24 | 3.56 | 5.71 | 8.27 |
| FC4 [6] (sRGB) | 426.31 | 118.30 | 282.05 | 561.92 | 7.91 | 4.57 | 7.33 | 10.38 | 9.78 | 6.12 | 9.14 | 12.65 |
| FC4 [6] (LRGB) | 179.55 | 33.89 | 100.09 | 246.50 | 6.14 | 2.62 | 4.73 | 8.40 | 6.55 | 3.54 | 5.90 | 8.94 |
| Quasi-U CC [7] (LRGB) | 172.43 | 33.53 | 97.9 | 237.26 | 6.00 | 2.79 | 4.85 | 8.15 | 6.04 | 3.24 | 5.27 | 8.11 |
| Exact achromatic reference point (sRGB) | 135.77 | 20.20 | 71.74 | 196.15 | 4.63 | 1.99 | 3.56 | 6.14 | 4.69 | 2.25 | 4.00 | 6.68 |
| Exact achromatic reference point (LRGB) | 130.01 | 19.73 | 68.54 | 183.65 | 4.29 | 1.85 | 3.35 | 5.70 | 4.59 | 2.24 | 3.89 | 6.51 |
| Ours | 77.79 | 13.74 | 39.62 | 94.01 | 3.06 | 1.74 | 2.54 | 3.76 | 3.58 | 2.07 | 3.09 | 4.55 |
Quantitative results (Set 2)
Our results obtained using all training data in Set 1. Please, check our source code to compute the error between corrected and ground-truth images from here. *You can download this table as a LaTeX file from here*.
| Method | MSE | MAE | Delta E 2000 | |||||||||
|---|---|---|---|---|---|---|---|---|---|---|---|---|
| Mean | Q1 | Q2 (median) | Q3 | Mean | Q1 | Q2 (median) | Q3 | Mean | Q1 | Q2 (median) | Q3 | |
| Adobe Photoshop (AC) | 745.49 | 240.58 | 514.33 | 968.27 | 10.19 | 5.25 | 8.60 | 14.13 | 11.71 | 7.56 | 11.41 | 15.00 |
| Adobe Photoshop (AT) | 953.85 | 386.7 | 743.84 | 1256.94 | 11.91 | 7.01 | 10.70 | 15.92 | 13.12 | 9.63 | 13.18 | 16.5 |
| Gray world [1] (sRGB) | 500.18 | 173.69 | 332.75 | 615.40 | 8.89 | 5.82 | 8.32 | 11.33 | 10.74 | 7.92 | 10.29 | 13.12 |
| Gray world [1] (LRGB) | 469.86 | 163.07 | 312.28 | 574.85 | 8.61 | 5.44 | 7.94 | 10.93 | 10.68 | 7.70 | 10.13 | 13.15 |
| Gray edges-1 [2] (sRGB) | 791.10 | 235.37 | 524.94 | 1052.38 | 12.90 | 7.98 | 12.41 | 17.50 | 13.09 | 9.17 | 12.98 | 16.68 |
| Gray edges-1 [2] (LRGB) | 779.27 | 225.36 | 510.03 | 1038.71 | 12.55 | 7.55 | 11.87 | 17.00 | 12.98 | 9.06 | 12.86 | 16.57 |
| Gray edges-2 [2] (sRGB) | 841.83 | 239.58 | 542.07 | 1114.86 | 13.16 | 7.94 | 12.55 | 17.76 | 13.31 | 9.20 | 13.20 | 17.09 |
| Gray edges-2 [2] (LRGB) | 831.01 | 231.42 | 530.52 | 1099.75 | 12.84 | 7.64 | 12.13 | 17.45 | 13.22 | 9.00 | 13.13 | 17.01 |
| Weighted gray edges [3] (sRGB) | 999.95 | 236.46 | 587.55 | 1350.41 | 13.80 | 8.08 | 12.99 | 18.80 | 14.05 | 9.13 | 13.80 | 18.56 |
| Weighted gray edges [3] (LRGB) | 990.20 | 230.38 | 577.62 | 1345.52 | 13.52 | 7.76 | 12.62 | 18.56 | 14.00 | 9.00 | 13.70 | 18.56 |
| Max-RGB [4] (sRGB) | 791.99 | 263.00 | 572.23 | 1087.14 | 13.47 | 8.44 | 12.93 | 18.50 | 13.01 | 9.12 | 13.44 | 17.15 |
| Max-RGB [4] (LRGB) | 780.63 | 256.40 | 560.58 | 1073.22 | 13.18 | 8.15 | 12.57 | 18.12 | 12.93 | 9.02 | 13.36 | 17.08 |
| Shades of gray [5] (sRGB) | 429.35 | 147.05 | 286.84 | 535.72 | 9.54 | 5.72 | 8.85 | 12.65 | 10.01 | 7.09 | 9.85 | 12.69 |
| Shades of gray [5] (LRGB) | 393.85 | 137.21 | 267.37 | 497.40 | 8.96 | 5.31 | 8.26 | 11.97 | 9.81 | 6.87 | 9.67 | 12.46 |
| FC4 [6] (sRGB) | 662.53 | 304.88 | 524.42 | 817.57 | 8.92 | 5.94 | 8.03 | 10.84 | 12.12 | 8.94 | 11.79 | 14.76 |
| FC4 [6] (LRGB) | 505.30 | 142.46 | 307.77 | 635.35 | 10.37 | 5.31 | 9.26 | 14.15 | 10.82 | 7.39 | 10.64 | 13.77 |
| Quasi-U CC [7] (LRGB) | 553.54 | 146.85 | 332.42 | 717.61 | 10.47 | 5.94 | 9.42 | 14.04 | 10.66 | 7.03 | 10.52 | 13.94 |
| Exact achromatic reference point (sRGB) | 422.31 | 110.70 | 257.76 | 526.16 | 7.99 | 4.36 | 7.11 | 10.57 | 8.53 | 5.52 | 8.38 | 11.11 |
| Exact achromatic reference point (LRGB) | 385.23 | 99.05 | 230.86 | 475.72 | 7.22 | 3.80 | 6.34 | 9.54 | 8.15 | 5.07 | 7.88 | 10.68 |
| Ours | 171.09 | 37.04 | 87.04 | 190.88 | 4.48 | 2.26 | 3.64 | 5.95 | 5.60 | 3.43 | 4.90 | 7.06 |
Quantitative results (Rendered version of Cube+)
Our results obtained using all training data in Set 1. To compute the mean error for each image, please remember to subtract the calibration object's pixels from the total number of image pixels. Please, check our source code to compute the error between corrected and ground-truth images from here. *You can download this table as a LaTeX file from here*.
| Method | MSE | MAE | Delta E 2000 | |||||||||
|---|---|---|---|---|---|---|---|---|---|---|---|---|
| Mean | Q1 | Q2 (median) | Q3 | Mean | Q1 | Q2 (median) | Q3 | Mean | Q1 | Q2 (median) | Q3 | |
| Gray world [1] (sRGB) | 312.62 | 55.16 | 159.63 | 358.02 | 6.85 | 3.08 | 5.76 | 9.70 | 9.01 | 5.35 | 8.38 | 12.08 |
| Gray world [1] (LRGB) | 244.59 | 32.58 | 121.42 | 300.99 | 6.37 | 2.51 | 5.13 | 9.09 | 8.05 | 4.18 | 7.25 | 11.08 |
| Gray edges-1 [2] (sRGB) | 461.12 | 25.10 | 94.45 | 557.55 | 8.65 | 2.49 | 5.16 | 13.14 | 9.72 | 3.76 | 6.89 | 15.26 |
| Gray edges-1 [2] (LRGB) | 331.26 | 17.11 | 67.92 | 362.25 | 7.31 | 2.11 | 4.43 | 10.79 | 8.18 | 3.03 | 5.81 | 12.43 |
| Gray edges-2 [2] (sRGB) | 394.37 | 25.50 | 87.61 | 451.65 | 8.01 | 2.43 | 4.03 | 11.70 | 9.11 | 3.73 | 6.65 | 13.80 |
| Gray edges-2 [2] (LRGB) | 322.29 | 17.17 | 65.40 | 349.09 | 7.16 | 2.08 | 4.25 | 10.56 | 8.05 | 3.05 | 5.62 | 12.10 |
| Weighted gray edges [3] (sRGB) | 416.53 | 22.92 | 81.27 | 424.65 | 7.99 | 2.33 | 4.78 | 11.60 | 9.02 | 3.53 | 6.38 | 13.67 |
| Weighted gray edges [3] (LRGB) | 352.41 | 15.83 | 61.27 | 349.23 | 7.26 | 2.01 | 4.22 | 10.64 | 8.17 | 2.93 | 5.48 | 12.28 |
| Max-RGB [4] (sRGB) | 465.93 | 19.12 | 83.04 | 554.94 | 8.60 | 2.25 | 5.05 | 13.41 | 9.54 | 3.30 | 6.40 | 15.47 |
| Max-RGB [4] (LRGB) | 448.56 | 18.98 | 82.80 | 538.27 | 8.41 | 2.24 | 4.97 | 13.18 | 14.23 | 3.93 | 8.46 | 22.72 |
| Shades of gray [5] (sRGB) | 269.31 | 21.92 | 90.37 | 312.02 | 6.69 | 2.30 | 4.63 | 9.62 | 7.70 | 3.40 | 6.38 | 11.07 |
| Shades of gray [5] (LRGB) | 275.33 | 17.16 | 67.49 | 309.97 | 6.66 | 2.08 | 4.17 | 9.58 | 7.57 | 3.00 | 5.73 | 11.05 |
| FC4 [6] (sRGB) | 410.01 | 79.26 | 219.05 | 505.71 | 6.70 | 3.26 | 5.45 | 8.70 | 10.40 | 6.51 | 9.73 | 13.43 |
| FC4 [6] (LRGB) | 371.9 | 79.15 | 213.41 | 467.33 | 6.49 | 3.34 | 5.59 | 8.59 | 10.38 | 6.60 | 9.76 | 13.26 |
| Quasi-U CC [7] (LRGB) | 292.18 | 15.57 | 55.41 | 261.58 | 6.12 | 1.95 | 3.88 | 8.83 | 7.25 | 2.89 | 5.21 | 10.37 |
| Ours | 194.98 | 27.43 | 57.08 | 118.21 | 4.12 | 1.96 | 3.17 | 5.04 | 5.68 | 3.22 | 4.61 | 6.70 |
Quantitative results/Delta E76 (Set 1, Set 2, and rendered version of Cube+)
In the following table, we report the results using Delta E 76 using Set 1, Set 2, and the rendered version of Cube+. Please, check our source code to compute the error between corrected and ground-truth images from here. *You can download this table as a LaTeX file from here*.
| Method | Set 1 | Set 2 | Rendered Cube+ | |||||||||
|---|---|---|---|---|---|---|---|---|---|---|---|---|
| Mean | Q1 | Q2 (median) | Q3 | Mean | Q1 | Q2 (median) | Q3 | Mean | Q1 | Q2 (median) | Q3 | |
| Adobe Photoshop (AC) | 14.13 | 7.35 | 11.73 | 18.43 | 17.86 | 9.65 | 16.11 | 23.63 | - | - | - | - |
| Adobe Photoshop (AT) | 15.42 | 8.83 | 14.24 | 20.53 | 20.53 | 13.84 | 19.42 | 26.42 | - | - | - | - |
| Gray world [1] (sRGB) | 8.48 | 5.38 | 7.91 | 11.03 | 15.13 | 10.07 | 13.68 | 18.91 | 12.27 | 6.19 | 10.45 | 16.20 |
| Gray world [1] (LRGB) | 11.12 | 6.38 | 9.96 | 14.57 | 14.89 | 9.77 | 13.40 | 18.86 | 10.85 | 4.77 | 9.08 | 14.88 |
| Gray edges-1 [2] (sRGB) | 9.09 | 4.75 | 8.01 | 12.13 | 19.99 | 12.36 | 18.77 | 26.38 | 14.39 | 4.51 | 9.05 | 22.42 |
| Gray edges-1 [2] (LRGB) | 8.98 | 4.69 | 7.85 | 11.89 | 19.76 | 12.02 | 18.55 | 26.17 | 11.87 | 3.63 | 7.5 | 17.75 |
| Gray edges-2 [2] (sRGB) | 9.47 | 4.86 | 8.26 | 12.63 | 20.54 | 12.75 | 19.06 | 26.98 | 13.07 | 4.37 | 8.53 | 19.65 |
| Gray edges-2 [2] (LRGB) | 9.35 | 4.81 | 8.08 | 12.43 | 20.33 | 12.44 | 18.68 | 26.85 | 11.6 | 3.60 | 7.29 | 17.20 |
| Weighted gray edges [3] (sRGB) | 9.68 | 4.71 | 8.18 | 12.90 | 22.48 | 12.48 | 20.37 | 30.31 | 13.25 | 4.16 | 8.28 | 19.44 |
| Weighted gray edges [3] (LRGB) | 9.60 | 4.66 | 8.08 | 12.71 | 22.32 | 12.28 | 20.13 | 30.16 | 12.01 | 3.49 | 7.18 | 17.52 |
| Max-RGB [4] (sRGB) | 11.52 | 5.03 | 9.73 | 16.34 | 20.52 | 13.31 | 19.96 | 26.99 | 14.43 | 3.95 | 8.52 | 23.04 |
| Max-RGB [4] (LRGB) | 11.35 | 4.98 | 9.51 | 16.04 | 20.34 | 13.15 | 19.77 | 26.77 | 9.46 | 3.29 | 6.35 | 15.29 |
| Shades of gray [5] (sRGB) | 8.10 | 4.26 | 7.28 | 10.83 | 14.15 | 9.26 | 13.21 | 18.10 | 10.67 | 3.99 | 8.06 | 15.24 |
| Shades of gray [5] (LRGB) | 8.11 | 4.30 | 7.19 | 10.78 | 13.74 | 8.88 | 12.84 | 17.61 | 10.63 | 3.57 | 7.28 | 15.27 |
| FC4 [6] (sRGB) | 13.22 | 7.82 | 12.13 | 17.05 | 17.23 | 12.05 | 16.31 | 20.83 | 13.72 | 7.26 | 11.99 | 17.85 |
| FC4 [6] (LRGB) | 8.73 | 4.25 | 7.49 | 11.83 | 15.89 | 9.49 | 14.35 | 20.46 | 13.42 | 7.40 | 11.98 | 17.39 |
| Quasi-U CC [7] (LRGB) | 8.08 | 4.00 | 6.88 | 10.77 | 15.70 | 9.35 | 14.46 | 20.47 | 9.78 | 3.40 | 6.69 | 14.18 |
| Exact achromatic reference point (sRGB) | 6.34 | 2.82 | 5.34 | 9.07 | 12.83 | 7.45 | 11.80 | 16.54 | - | - | - | - |
| Exact achromatic reference point (LRGB) | 6.13 | 2.80 | 5.18 | 8.75 | 12.12 | 6.91 | 10.97 | 15.63 | - | - | - | - |
| Ours | 4.56 | 2.51 | 3.92 | 5.87 | 7.46 | 4.19 | 6.04 | 9.38 | 7.23 | 3.74 | 5.59 | 8.56 |
References:
- G. Buchsbaum. "A spatial processor model for object colour perception." Journal of the Franklin Institute, 1980.
- J. V. D. Weijer, T. Gevers, and A. Gijsenij. "Edge-based color constancy." TIP, pp. 2207-2214, 2007.
- A. Gijsenij, T. Gevers, and J. V. D. Weijer. "Improving color constancy by photometric edge weighting." TPAMI, 2011.
- D. H. Brainard and B. A. Wandell, "Analysis of the retinex theory of color vision.", JOSA, 1986.
- G. D. Finlayson and E. Trezzi, "Shades of gray and colour constancy.", Color and Imaging Conference, 2004.
- Y. Hu, B. Wang, and S. Lin. "Fc4: Fully convolutional color constancy with confidence-weighted pooling.", CVPR, 2017.
- S. Bianco and C. Cusano. "Quasi-unsupervised color constancy.", CVPR, 2019.